
Observability pipeline
The boundaries between History, DiscoverEvent, Statis, and OpenTelemetry in the Control Plane.
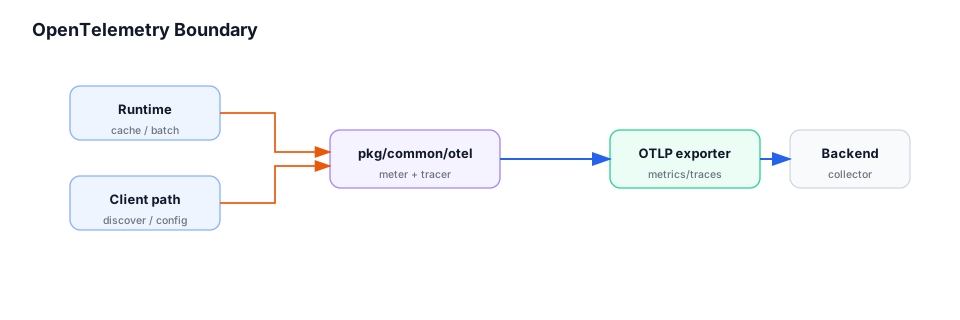
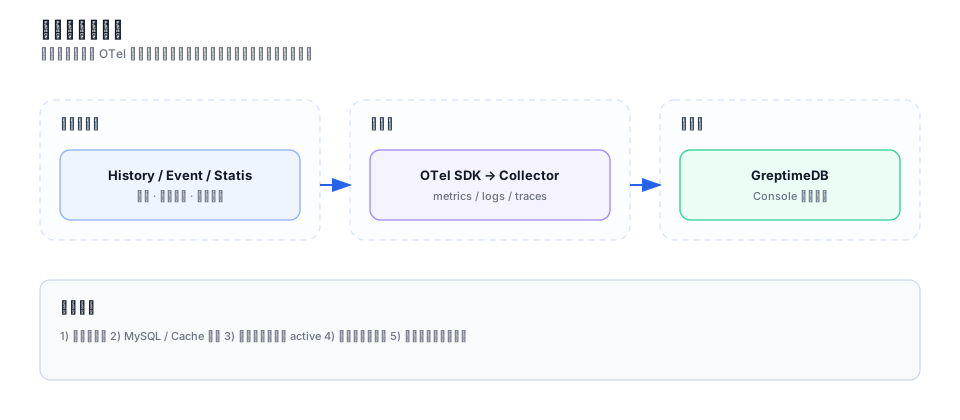
Control-plane observability has two layers. Internal plugin interfaces model product events and statistics; pkg/common/otel initializes OpenTelemetry tracing, metrics, and runtime instrumentation for export.
History
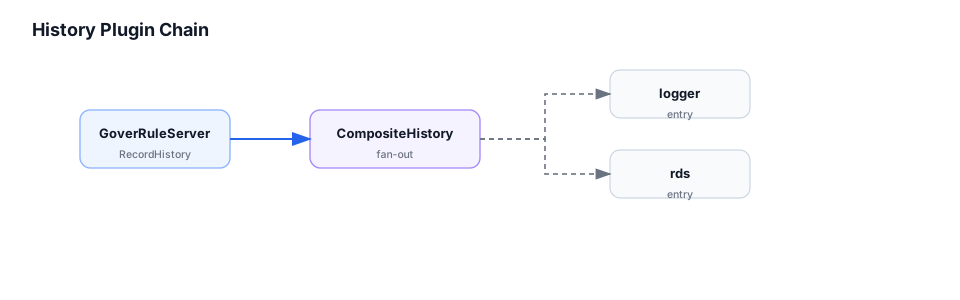
History records management operations and resource changes through registered entries. It is the product audit/history model, not automatically an OpenTelemetry log stream.
DiscoverEvent
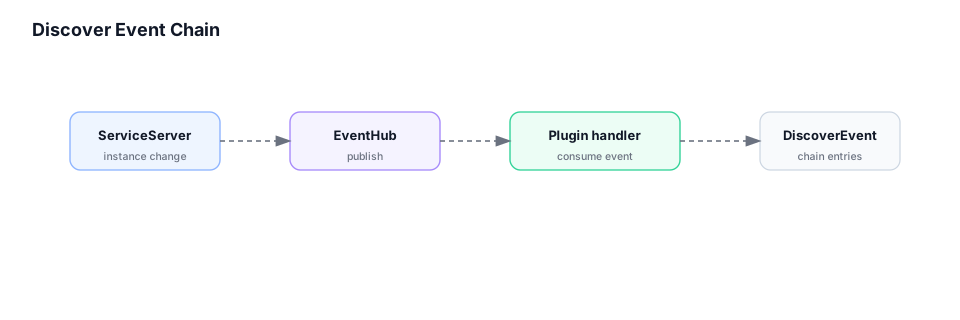
DiscoverEvent publishes service-discovery lifecycle events to registered entries. Consumers can persist, display, or export those events without coupling discovery services to a specific backend.
Statis
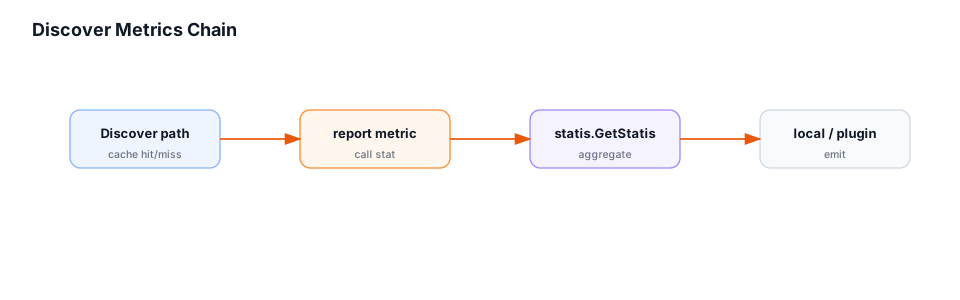
Statis aggregates API calls, discovery calls, configuration metrics, cache behavior, and other platform measurements. Callers report typed metrics rather than writing directly to a monitoring database.
OpenTelemetry SDK
The OTel layer configures tracer and meter providers, OTLP export, resource attributes, and selected Go runtime metrics. Existing measurements include registration cost, expired registration tasks, cache update cost, unfinished batch jobs, discovery/configuration connections, and SDK client totals.
Extension path
An OTel entry can translate:
- History records into logs or structured events.
- DiscoverEvent records into events.
- Statis aggregates into metrics.
That adapter must preserve the internal meaning and choose bounded labels. High-cardinality identifiers should not be placed on general metrics.
Boundary
History, DiscoverEvent, and Statis are Lattice Hub product semantics. OpenTelemetry is the instrumentation and export standard. Neither replaces the other, and Control Plane telemetry does not substitute for application or data-plane request telemetry.
How to use this for troubleshooting
- Verify the main path first: Console/HTTP/gRPC ports, MySQL, and CacheManager refresh.
- Check product signals: History, DiscoverEvent, and Statis.
- Only then inspect Collector / GreptimeDB / the platform metrics page. Missing observability stack data does not mean the control plane is down.
- Separate client issues (wrong port, unpublished release, Sidecar miss) from control-plane failures.