
Metrics
Four Console metrics pages—system, service, events, and operation audit—and how to use them.
Menu: Metrics with four secondary pages. Data comes from OTel → Collector → GreptimeDB (plus control-plane event/audit paths). Pages may show “Live data” or “Mock preview”; confirm the source first.
System metrics
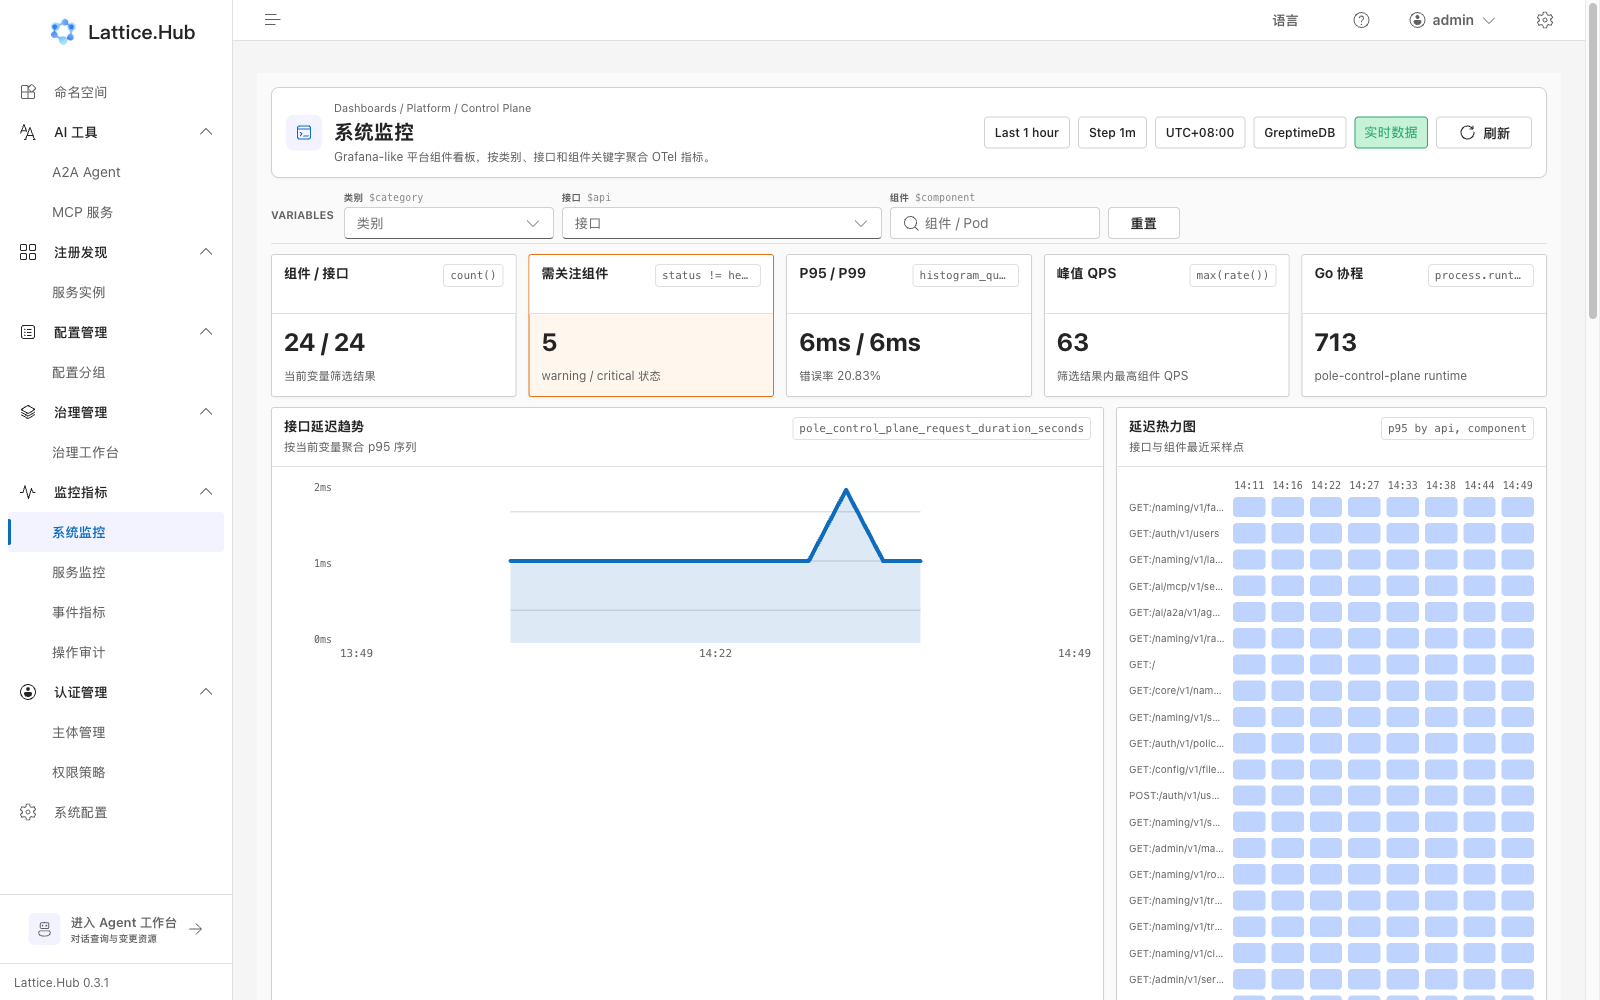
Path: /metrics/system, title “System metrics”.
Purpose: Grafana-like platform component dashboards aggregated by category, API, and component keywords from OTel.
Common panels:
- API latency trends
- Latency heatmaps
- Go runtime
- Component resources
- API details
Filter by category/component/API keyword to judge control-plane health.
Service metrics
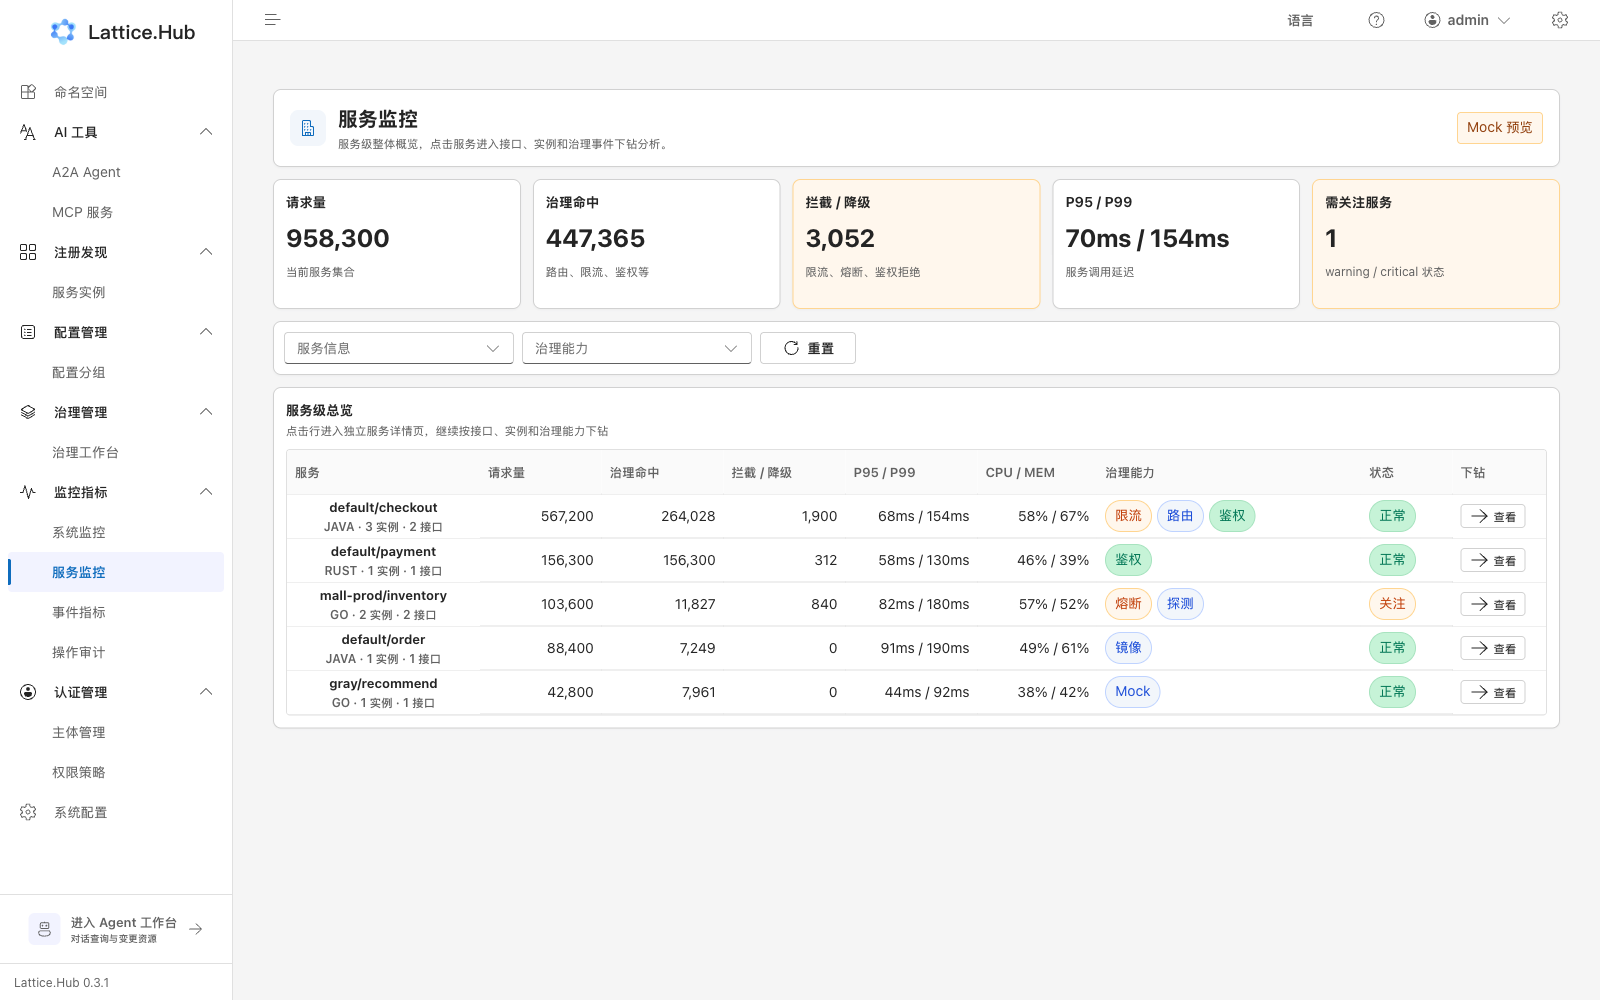
Path: /metrics/service (detail /metrics/service/detail), title “Service metrics”.
Purpose: service-level overview; drill into APIs, instances, and governance events.
Common stats: request volume, governance hits, intercept/degrade, P95/P99, services needing attention.
Event metrics
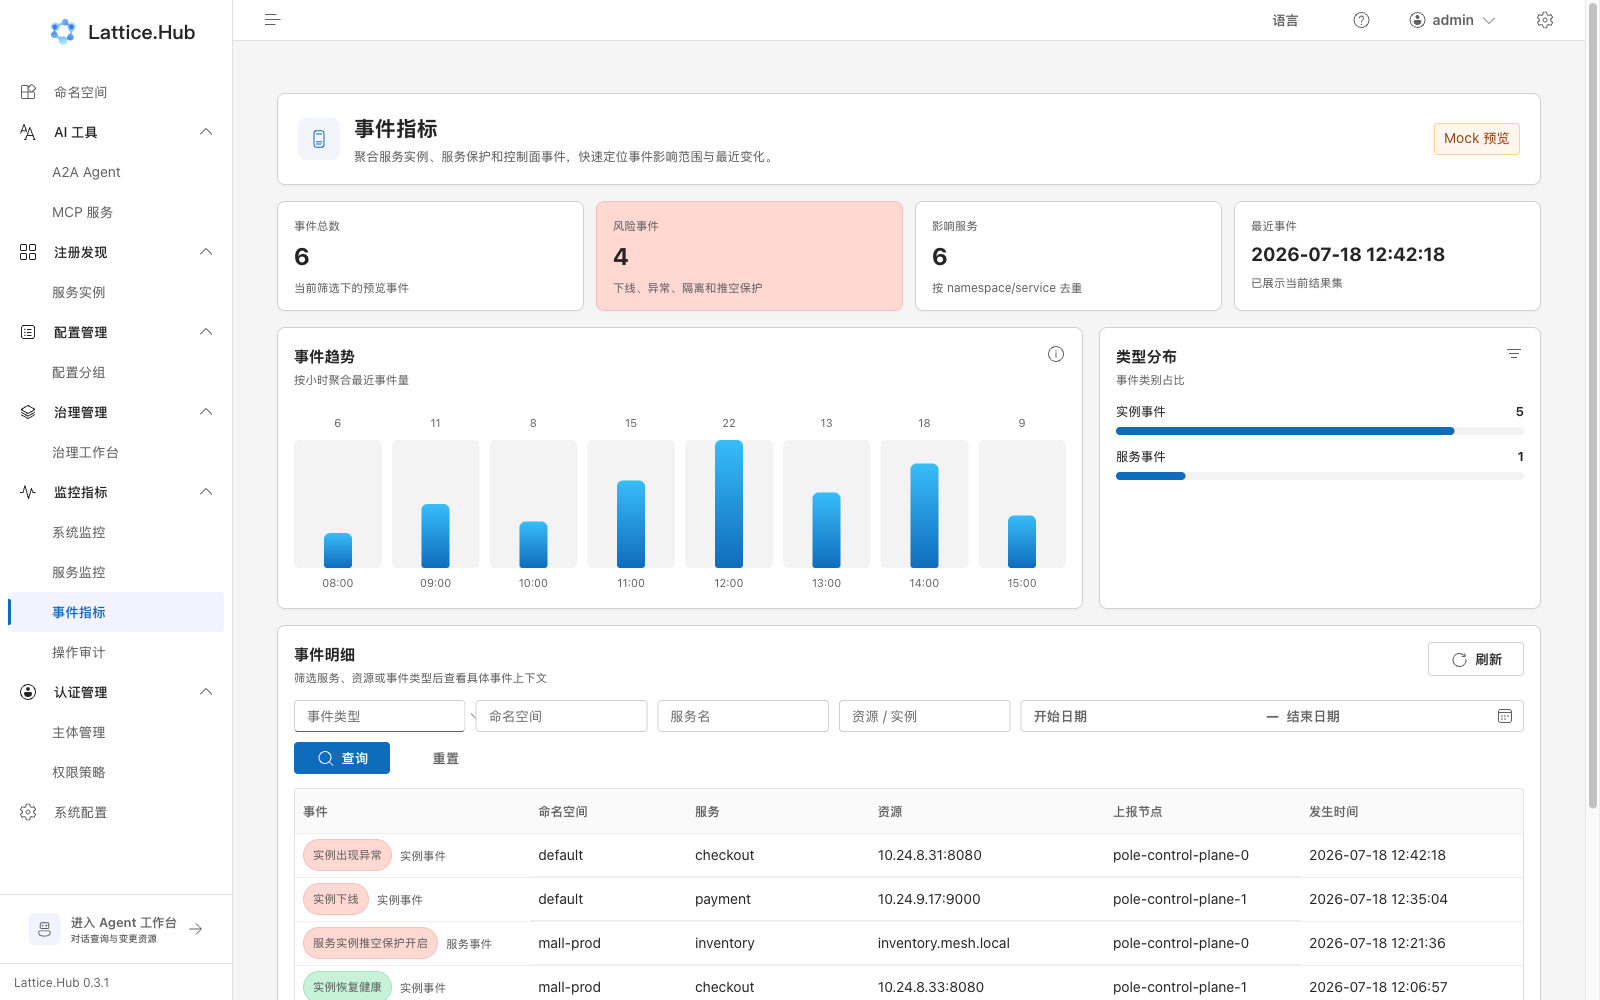
Path: /metrics/event, title “Event metrics”.
Purpose: server event totals, risk events, affected services, recent events; trends, type distribution, and event details. Filter and open detail as needed.
Operation audit
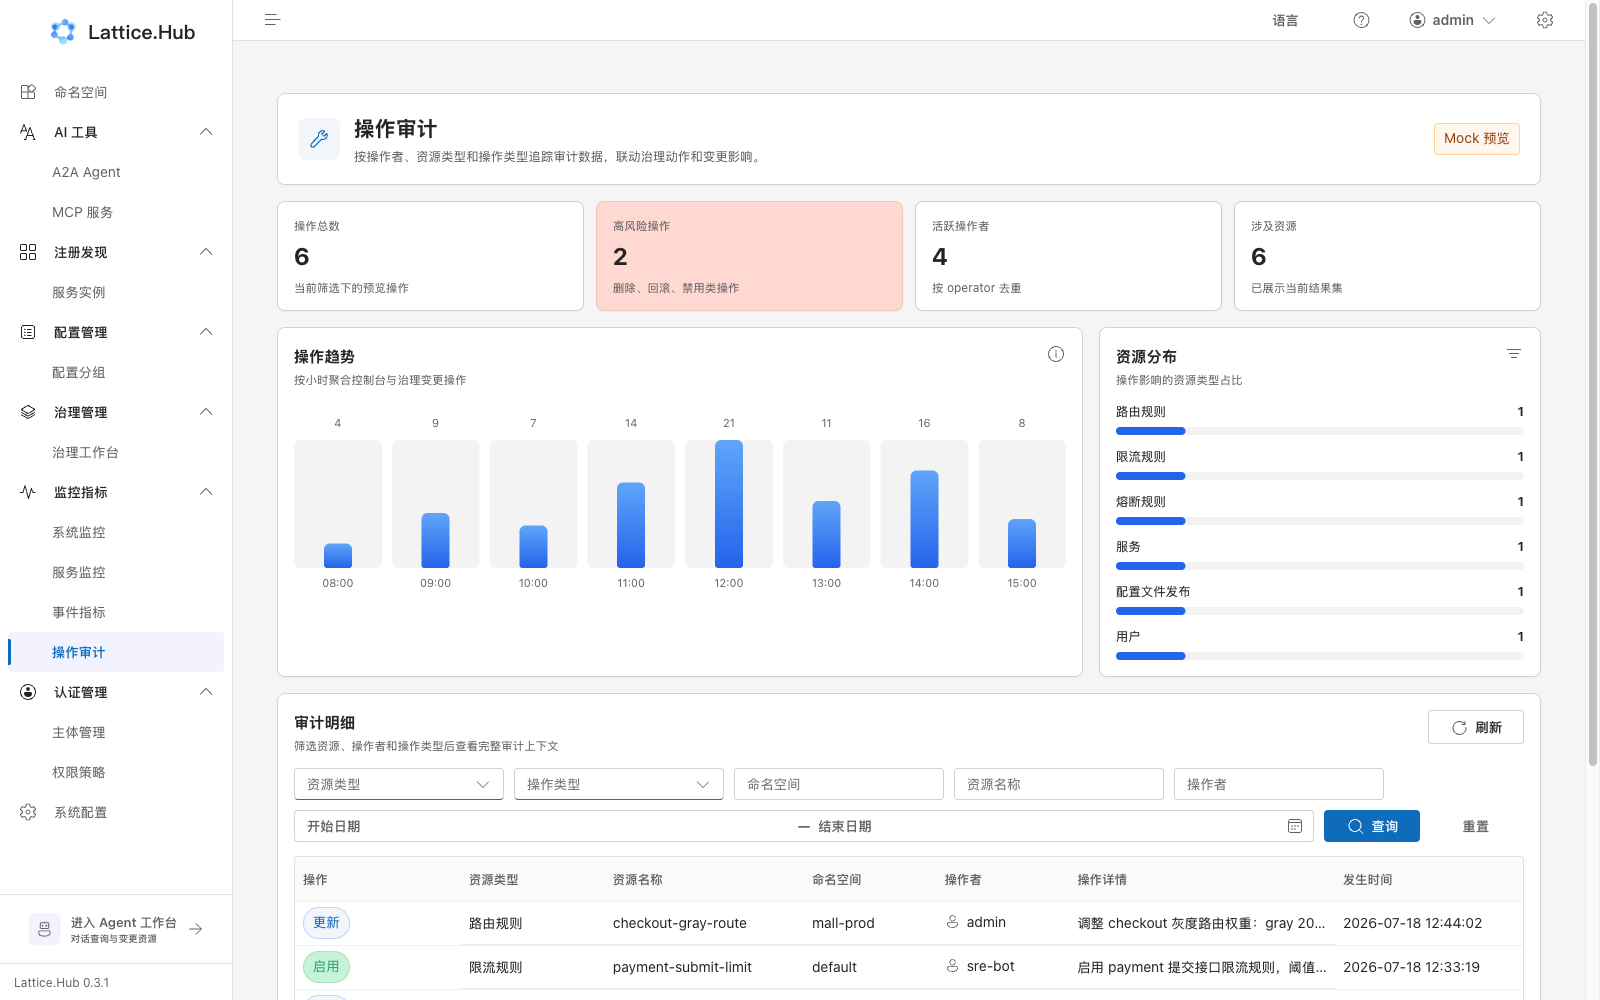
Path: /metrics/operation, title “Operation audit”.
Purpose: operation totals, high-risk ops, active operators, involved resources; trends, resource distribution, audit details. Use to answer who changed which resources when.
Troubleshooting order
- Confirm the control-plane main path (login, API, cache, publish).
- Check system metrics for component/API anomalies.
- Use service metrics to pinpoint a service.
- Use events and operation audit for “what happened / who did it”.
- If all four pages are empty, check whether the observability stack is deployed before assuming the control plane is down.
See Observability pipeline and Performance report.