
Performance data report
Confirmed configuration facts, observation dimensions, and planned benchmarks—without invented numbers.
This first edition records confirmed facts and planned measurements only. There is no formal benchmark dataset to cite, so throughput/latency/resource numbers are not invented here.
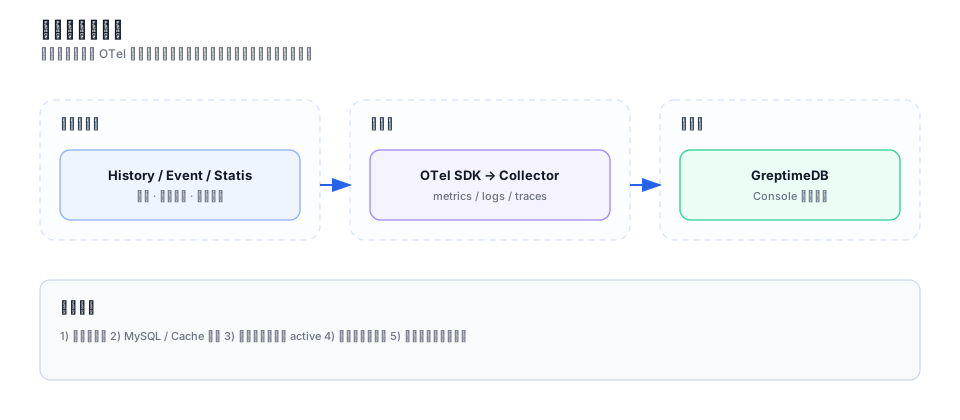
Confirmed configuration facts
| Area | Fact |
|---|---|
| Cache refresh | Core caches refresh about every 1s |
| Overlap window | Incremental queries use lastMtime - 5s |
| Config paging | Max page size 100 |
| Config content | Max 20,000 characters |
| Batch example | Queue 10000, wait 32ms, max batch 128, concurrency 128 |
| MySQL pool example | maxOpenConns=100, maxIdleConns=10 (overridable) |
| Health-check example | slotNum=30, min 10s, max 60s |
| Default ports | Console 8080; HTTP 8090; Discover 8091; Config 8093; xDS 15010 |
These are implementation facts, not benchmark conclusions.
Suggested observation dimensions
| Scenario | Capture |
|---|---|
| Discovery | QPS, P95/P99, revision hit vs full response-cache hit |
| Config watch | Connections, push/long-poll latency, client version convergence |
| Governance publish | Time to active cache, rollback time |
| Sidecar | HTTP/1.1, HTTP/2, gRPC-h2c throughput and tail latency |
| Controller | Full vs demand sync event handling time |
Planned benchmarks
- Control Plane discovery throughput, tail latency, and cache-hit behavior.
- Configuration publish / progressive delivery / rollback latency.
- SSE/long-poll connection count, memory, and CPU under many clients.
- Pole Sidecar forward performance by protocol.
- Kubernetes Controller sync latency for
allanddemand.
Reporting rules
Separate configuration facts from benchmark conclusions. Do not publish numbers without reproducible commands, environment notes, and raw data.
See also Observability pipeline and Server installation.